Image boundaries
Tracing a plant boundary from a scan, a screenshot or an exported picture, and setting the scale in the Site reference window that turns pixels into metres.
When the only record of the site is a picture — a scanned site plan, a screenshot of a map, an image exported from a report — the application can trace the boundary out of it. You supply the scale; it finds the outline.
This is the least capable of the three inputs and the one that most rewards a tidy source image. It carries one boundary, no named features and no position on the earth. Where a Google Earth file exists, use that instead — see Which boundary file to use.
Accepted formats
.jpg .jpeg .png .gif .bmp .tif .tiff
What is traced
The largest closed outline in the image becomes the boundary. Nothing else in the image is used, and one image yields one boundary — a multi-plot site cannot be described this way.
That rule is worth reading twice, because it is also the failure mode. If the image has a border, a page frame, a map neat line or a legend box that encloses more area than the site outline does, that shape wins and becomes your plant boundary. Crop the image down to the site before loading it.
The Site reference window
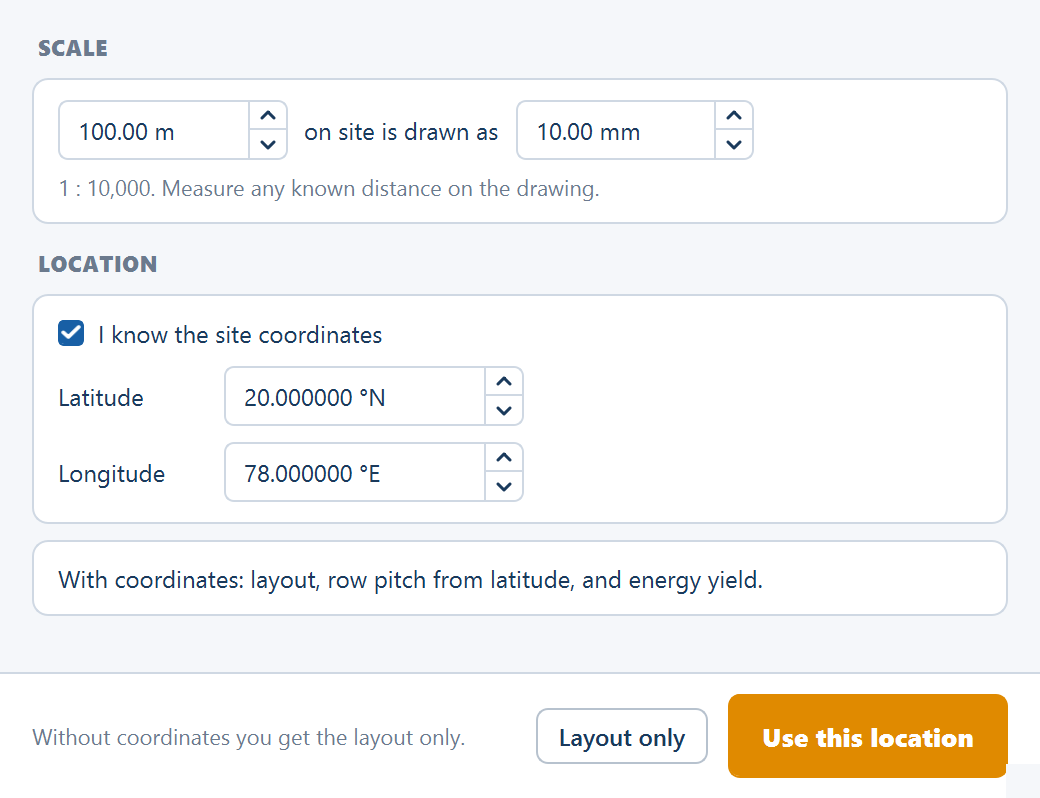
An image has no units and no position. Choosing one with Browse… on the Site tab opens the Site reference window with two cards: SCALE first, then LOCATION.
The scale
The SCALE card is a single sentence with two numbers in it: 100.00 m on site is drawn as 10.00 mm. A live hint under it reads the pair back as a drawing scale — 1 : 10,000. Measure any known distance on the drawing. — and updates as you type.
| Field | Default | Range | What it does |
|---|---|---|---|
| … m on site | 100.00 m | 0.1–1 000 000 m | A distance on the ground |
| … is drawn as … mm | 10.00 mm | 0.01–100 000 mm | The distance that stands for it on the drawing |
Read the pair off the scale bar or the title block of the plan you are tracing, or measure any two points whose real separation you know. Both footer buttons keep the scale you entered.
From millimetres to pixels
The scale pair fixes metres per millimetre. Turning that into metres per pixel needs the image's resolution in dots per inch, which is read from the image's own metadata and defaults to 96 dpi when the image does not declare one:
| Quantity | How it is found |
|---|---|
| Millimetres per pixel | 25.4 ÷ dpi |
| Metres per millimetre | site distance in metres ÷ drawing distance in millimetres |
| Metres per pixel | millimetres per pixel × metres per millimetre |
At the defaults — 96 dpi, 100 m drawn as 10 mm — one pixel is
25.4 / 96 × (100 / 10), about 2.65 m on the ground. A boundary traced 400
pixels across is therefore about 1 060 m across.
Resolution and scale multiply. An image that declares a different dpi from the one you assumed changes every dimension in the plant by that ratio, and nothing about the layout looks wrong when it happens — the shape is right, the size is not. After the first run, check the Site area chip against the acreage you expect, and adjust the scale pair until they agree.
The location
The LOCATION card, the banner and the footer are the same as for a CAD drawing: a ticked I know the site coordinates box, Latitude and Longitude, a Layout only button and the primary Use this location (which reads Continue without coordinates when the box is unticked). Supply the coordinates. Without them the layout is still generated geometrically, but energy calculation is unavailable — Calculate Energy is disabled — and the automatic tilt angle and row pitch are derived from the fallback position of 20° N, 78° E rather than from your site. The controls and the consequences are set out in full on CAD drawing boundaries.
If you have to work without coordinates, tick both override boxes in Spacing and tilt and enter the tilt angle and row pitch yourself, so at least the table count and the capacity are the ones you intend.
Getting a usable result
Give it a clean, high-contrast outline
The boundary must read as an unbroken closed line against its background. A crisp black outline on white traces well. A faint pencil line, a dashed boundary, a compressed screenshot with speckle around the line, or an outline crossing a busy aerial photograph traces badly or not at all. Redraw the boundary over the image in an image editor if that is what it takes.
Remove every closed shape larger than the boundary
Crop away page borders, map frames, legend and title blocks, north arrows in boxes, and any surrounding survey extent. Only the site outline should be the largest closed shape left.
Know the scale before you start
Find a stated scale, a scale bar, or two points whose real separation you know, and enter the pair on the SCALE card. Guessing here does not produce a slightly wrong plant; it produces a plant of the wrong capacity.
Check the reported area against the survey
Generate the layout and read the Site area chip under the plot, or the Plant area (acres) row of the Summary view. If it disagrees with the survey, the scale pair is wrong — correct it and load the image again. Do this before spending time on module, table or energy settings.
What an image cannot carry
- No named features. There is no classification by name, so water bodies, buildings and corridors cannot be described in the image at all.
- No interior exclusions. Only the boundary is traced.
- No position, unless you type the coordinates.
Add the exclusions after the layout is generated, by drawing them on the plot. See Obstructions and exclusions.
Where to go next
CAD drawing boundaries
Using a DXF or DWG as the plant boundary, what the Site reference window asks for, and why the site latitude and longitude decide whether energy can be calculated.
Module specifications
Module dimensions, wattage and bifacial settings on the Array tab, and what loading a manufacturer .PAN file fills in for you.