What SolarLayout Desktop does
A Windows application that turns a site boundary into a complete PV plant design — layout, energy yield, diagrams, and the drawings your team builds from.
SolarLayout Desktop is a Windows application for designing utility-scale solar PV plants. You give it the boundary of a site. It places the module tables, adds the control rooms, inverters, cables and lightning arresters, estimates the energy the plant will generate over its life, and produces the drawings and schedules an engineering team builds from.
It runs entirely on your own machine. The only steps that reach the internet are fetching weather data and fetching elevation data, and both are optional.
What you give it
One file describing where the plant goes:
A Google Earth file
KMZ or KML — the recommended input. Carries the boundary, water bodies, obstructions and transmission lines together.
A CAD drawing
DXF or DWG. Add the site latitude and longitude so energy can be calculated.
A scanned or exported image
A boundary drawn on an image, traced using a scale you supply.
Everything else — module dimensions, table configuration, spacing, equipment sizes, loss assumptions — has a working default, so a first layout takes a few minutes. See Your first layout.
What it produces
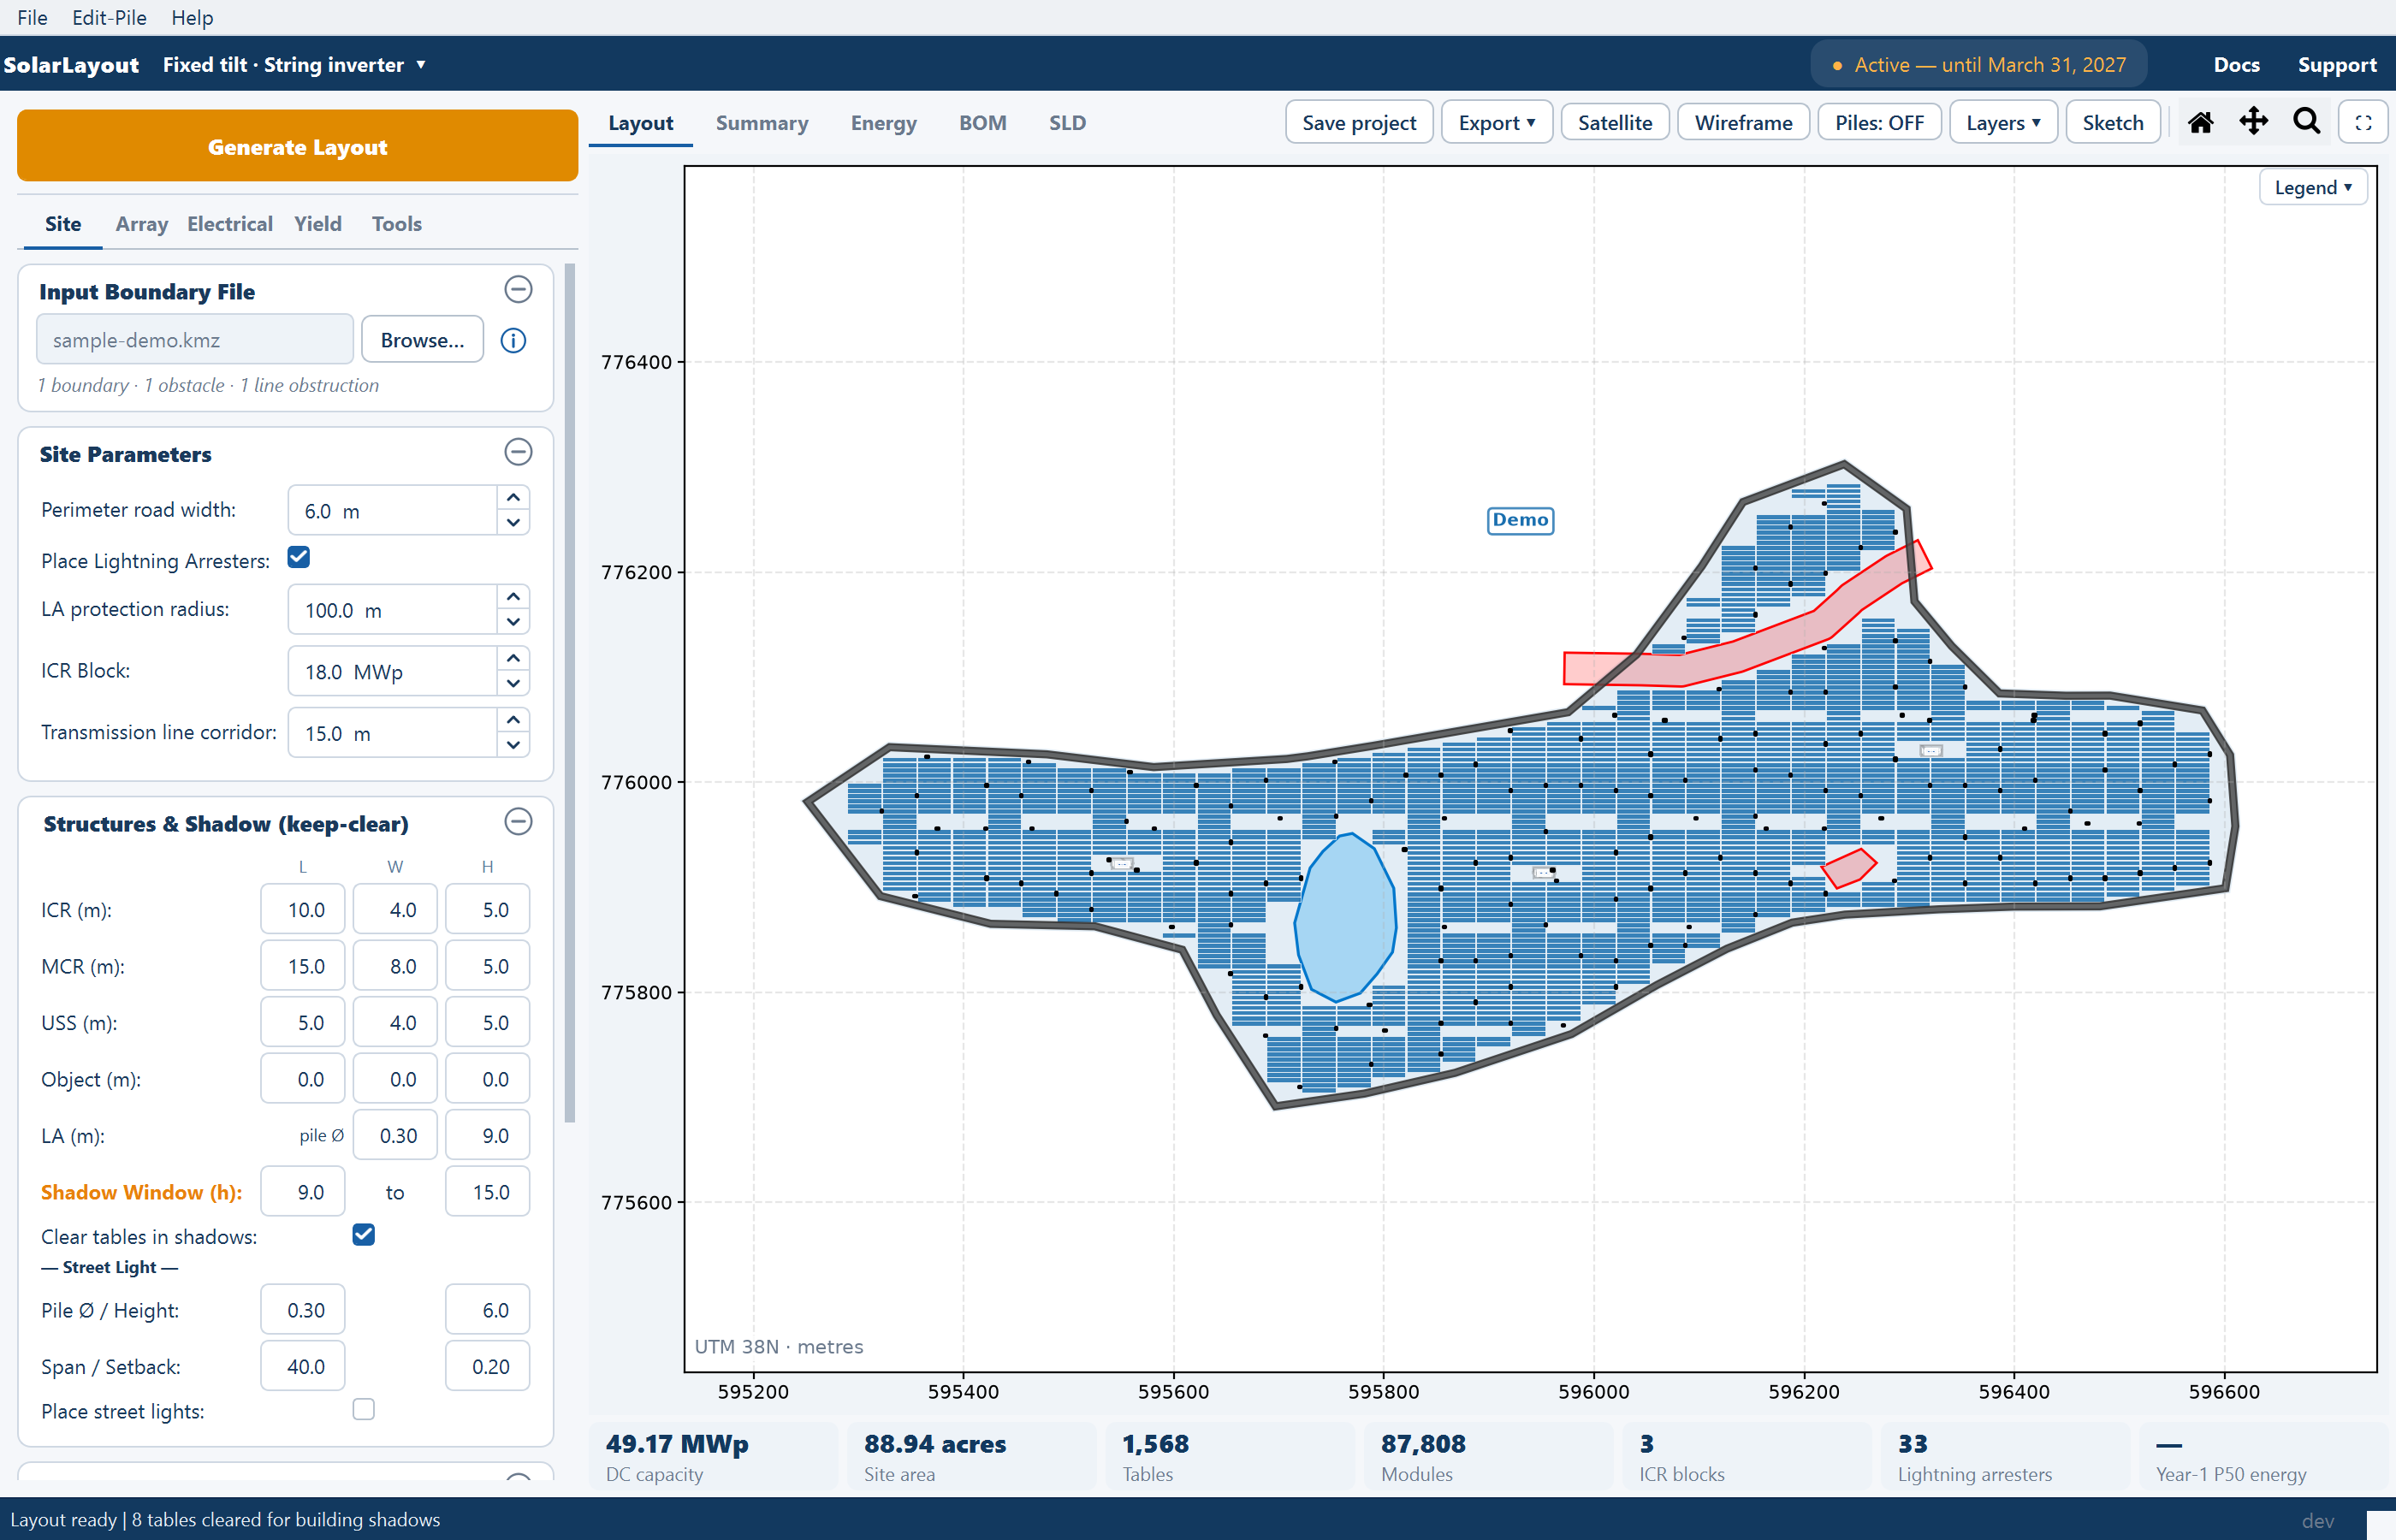
A placed layout. Module tables or tracker units filling the usable ground, with the perimeter road, water bodies, transmission line corridors, steep terrain and any obstructions kept clear. Rows run east to west and panels face the equator. See How placement works.
Electrical equipment. Inverter control rooms sized to a capacity block you set, string inverters or string monitoring boxes clustered across the plant, lightning arresters on a coverage grid, and — when you ask for it — routed DC, AC and medium-voltage cables with lengths. See Cable routing.
An energy estimate. Year-one and lifetime generation from a performance ratio you can break down loss by loss, with degradation, a capacity factor, and exceedance probabilities for a lender's case. See How yield is calculated.
Documents. A detailed project report as a Word document — cover page, methodology, design basis, results, energy yield, and the drawing annexures with the site layout plan, design summary, single-line diagram and bill of materials. Beside it, from the same Export ▾ menu: a Google Earth file, a layered CAD drawing, a drawing set with one sheet per ICR block, an Excel cable schedule, and the plot as an image. A PDF is produced only for the pile drawing, once a pile pattern is on. See The project report.
Two decisions you make at launch
Every launch opens the New design window, which asks how the plant is mounted and how it is wired. The choice changes which inputs you see and how the plant is put together, and it belongs to the window — a different design opens in a second window beside the first.
| Mounting | What it means |
|---|---|
| Fixed tilt | Modules sit at a fixed angle on static racks, facing the equator. |
| Single-axis tracker | Modules rotate about a horizontal north–south axis and sweep east to west through the day. |
| Inverter | What it means |
|---|---|
| String inverter | Many string inverters distributed across the plant, each feeding AC to a control room. |
| Central inverter | String monitoring boxes collect the strings and feed DC trunks to central inverters inside the control rooms. |
See Choosing a design mode for which to pick and what changes.
What it is not
- It is not a shading simulation tool. It models row-to-row shading and the year-round shadow of buildings you place, and it will keep tables out of those shadows — but it does not model terrain shading or distant horizon profiles.
- It is not a structural design tool. Structure heights and pile patterns are inputs used for shadow geometry and construction schedules, not engineering checks.
- It does not issue a grid connection study or a protection design. The single-line diagram is a drawing you build and edit, not a validated electrical model.