Losses & soiling
The losses model in detail, with focus on tuning soiling for your site conditions.
Production losses combine multiplicatively in SolarLayout's Performance Ratio. Total system-level losses typically land in the 12–18% range for utility-scale projects. Soiling is the line most worth tuning — it's the biggest variable and the one most specific to your site.
The losses stack
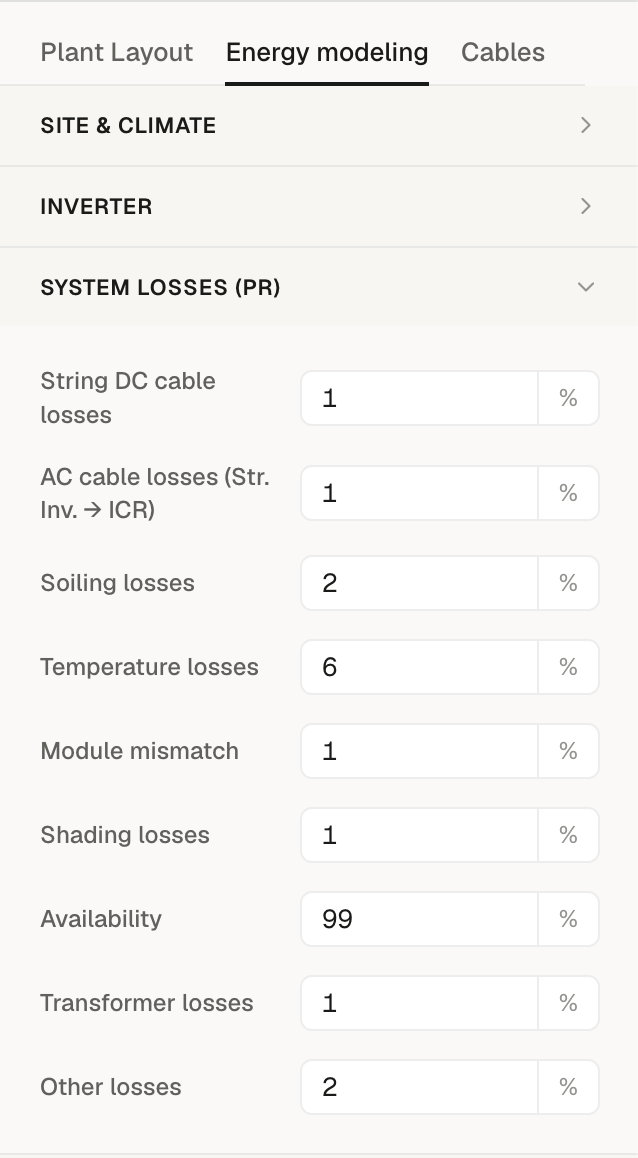
Every line below is a separate field in Energy panel → System Losses (PR), and each one combines into the overall Performance Ratio for the project.
| Loss field | Default | Typical range | Notes |
|---|---|---|---|
| String DC cable losses | 1.0% | 1–2% | Voltage drop in the DC array |
| AC cable losses (Str. Inv. → ICR) | 1.0% | 0.5–1% | Voltage drop in the AC collection network |
| Soiling losses | 2.0% | 2–4% | Highly site-specific; cleaning schedule matters |
| Temperature losses | 6.0% | 5–10% | Module derating from operating temperature; see below |
| Module mismatch | 1.0% | 1–2% | Module-to-module power variation within strings |
| Shading losses | 1.0% | 0–1% | Near-shading on well-sited plants |
| Availability | 99.0% | 99%+ | Time the system is operational |
| Transformer losses | 1.0% | 0.5–1% | LV-to-MV step-up at the ICR |
| Other losses | 2.0% | varies | Monitoring, auxiliary, miscellaneous |
Inverter efficiency is not a row here — it lives in the Inverter section and folds into the Performance Ratio automatically. When you pin an OND file (or a Managed catalog inverter), the efficiency is taken straight from it and locked. Without an OND pinned, you can type a custom inverter efficiency by hand in the Inverter section.
How the losses compound
Losses compound multiplicatively, not additively. A 3% soiling
loss and a 2% wiring loss combine as (1 − 0.03) × (1 − 0.02) = 0.951
— a 4.9% combined loss, not 5%.
For early-stage estimates, the additive approximation is close enough. For bankable yield models, the multiplicative compounding is what matters and what the engine uses.
Soiling — the line worth tuning
Soiling is the single biggest variable in the losses stack. A site in a drier inland region with no cleaning schedule can easily see 6–10% soiling losses; the same site with bi-weekly cleaning lands at 2–3%. That's a 4–7 percentage point swing in annual yield from one operational decision.
What drives soiling on your sites
- Dust load — arid regions see far more dust accumulation than wetter regions.
- Distance from agricultural land — particulate matter from field activity affects nearby plants.
- Distance from highways or industrial sites — traffic dust and industrial emissions deposit on modules.
- Cleaning schedule — frequency and method (dry vs wet, manual vs robotic).
- Rainfall pattern — monsoon naturally cleans modules; pre- monsoon dry months see the worst soiling.
How to set soiling in SolarLayout
In Energy panel → System Losses (PR) → Soiling losses, set the annual average soiling loss as a percentage.
If you don't know the right number for your site:
- Use 3% as a starting default for most utility-scale sites with a planned cleaning schedule.
- Use 5–6% for arid regions without an aggressive cleaning programme.
- Use 2% for sites with frequent rainfall (wetter regions) and a regular cleaning schedule.
For bankable models, use site-specific soiling measurements if they exist. A year of on-site soiling station data is the gold standard; absent that, regional studies are the fallback.
Temperature losses
Module operating temperature reduces efficiency, and Temperature losses is a tunable field in the same System Losses (PR) section. The shipped default is 6.0%.
SolarLayout also surfaces a separate Sandia thermal model preview in the Site & Climate section: the model uses the mounting type (open rack, close mount, insulated back), the site ambient temperature, and the average wind speed to estimate the annual average module temperature and the resulting loss. The preview runs on a fixed assumption for the module temperature coefficient (μpmpp = −0.35 %/°C, with G = 600 W/m²) — it does not yet read the temperature coefficient from a picked module's PAN file. It's read-only — a sanity check on the value you've entered in System Losses, not a direct substitute for it.
For sites where peak summer ambient regularly exceeds 40°C and module temperatures can hit 60°C+, temperature-derived losses of 7–10% are common. If your site is hotter than the 25°C default Avg. ambient temp. in Site & Climate, raise the temperature loss in System Losses to match.
Reading losses in the PDF energy report
The PDF energy report shows:
- The Performance Ratio derived from all loss components.
- The specific yield (kWh/kWp/year) — gross irradiance × PR.
- Year-1 and lifetime energy after first-year LID and annual degradation.
- The three configured exceedance values (P50 / P75 / P90 by default) for year-1 and lifetime figures.
- A monthly breakdown that re-applies a temperature loss per month using the seasonal ambient profile, so you can see where in the year the losses bite hardest.
See PVGIS vs custom CSV for tuning the weather data that drives the temperature and irradiance inputs.